Sold prices updated (Jun 2026): where they rose and fell
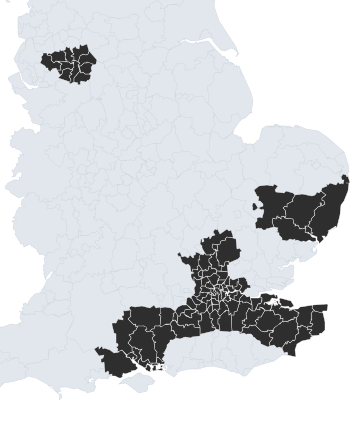
17,338 new sales landed across 75 areas; prices rose most in Welwyn Hatfield (+6.9% over 12 months), and softened most in City of London (−25.1%).
Biggest 12-month risers
Change in the House Price Index over the last 12 months
Biggest 12-month fallers
Change in the House Price Index over the last 12 months
Busiest markets
Sales in the last 12 months, as of this release
See the full sold-prices table in London →
Dig into your area
Search any place in England for a full, free, sourced report — prices, crime, schools, energy and more. Start on the map.
More from Explore
The map & hub · League tables · Places A–Z · Browse by commute.